import pandas as pd
import matplotlib.pyplot as plt
f = "../data/002_processed/esolmet_2018.parquet"
tmx = pd.read_parquet(f)
tmx = tmx[~tmx.index.duplicated()]
tmx.info()<class 'pandas.core.frame.DataFrame'>
DatetimeIndex: 51163 entries, 2018-01-01 00:00:00 to 2018-12-31 23:50:00
Data columns (total 8 columns):
# Column Non-Null Count Dtype
--- ------ -------------- -----
0 Ib 51163 non-null float64
1 Ig 51163 non-null float64
2 Id 51163 non-null float64
3 uv 51163 non-null float64
4 To 51163 non-null float64
5 hr 51163 non-null float64
6 ws 51163 non-null float64
7 p 51163 non-null float64
dtypes: float64(8)
memory usage: 3.5 MBtmx.To.plot()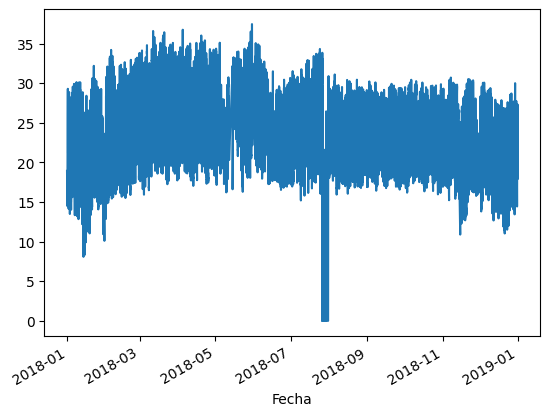
tmx_asfreq = tmx.asfreq("1h").copy()
tmx_mean = tmx.resample("1h").mean()tmx_asfreq.max(), tmx_mean.min()(Ib 1021.000
Ig 1197.000
Id 1125.000
uv 29.330
To 36.690
hr 134.000
ws 8.850
p 885.558
dtype: float64,
Ib 0.000000
Ig 0.000000
Id 0.000000
uv 0.000000
To 0.000000
hr 0.000000
ws 0.000000
p 446.968195
dtype: float64)mapa_asfreq = tmx_asfreq["To"].groupby(
by=[tmx_asfreq.index.month, tmx_asfreq.index.hour]
).mean().unstack().T
mapa_resample = tmx_mean["To"].groupby(
by=[tmx_mean.index.month, tmx_mean.index.hour]
).mean().unstack().Tfig, ax = plt.subplots(figsize=(12,4))
im = ax.imshow(mapa_asfreq,aspect=.2,cmap="jet",vmin=0,vmax=40)
cbar = ax.figure.colorbar(im, ax=ax)
ax.set_ylabel("horas")
ax.set_xlabel("meses")Text(0.5, 0, 'meses')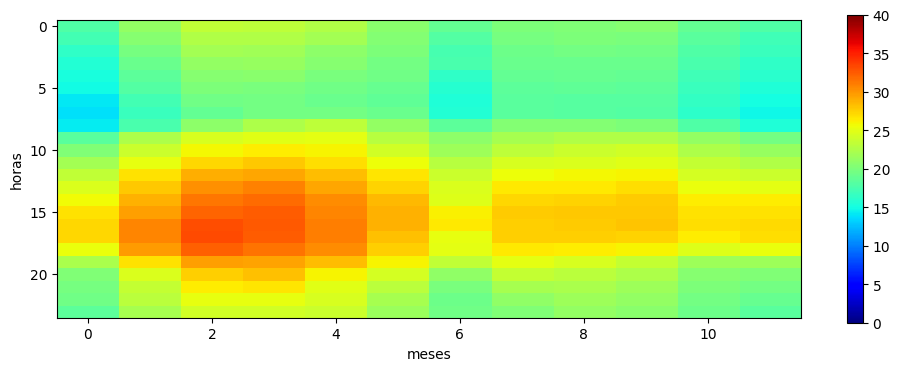
fig, ax = plt.subplots(figsize=(12,4))

im = ax.imshow(mapa_resample,aspect=.2,cmap="jet",vmin=0,vmax=38)
cbar = ax.figure.colorbar(im, ax=ax)

ax.set_ylabel("horas")
ax.set_xlabel("meses")
Text(0.5, 0, 'meses')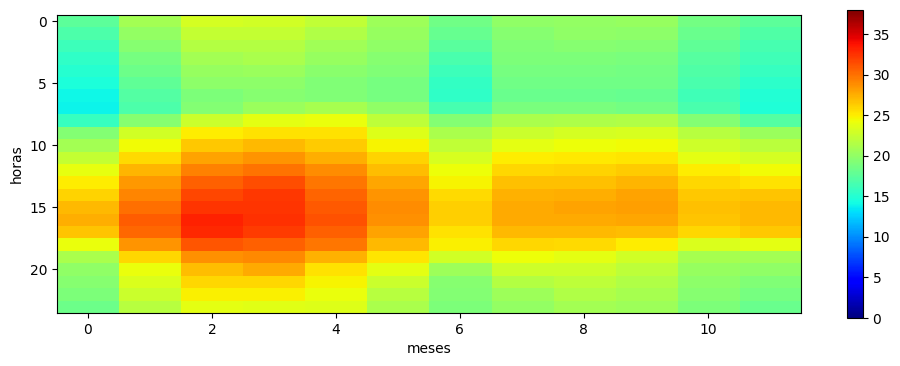
tmx.index.strftime("%H:%M")Index(['00:00', '00:10', '00:20', '00:30', '00:40', '00:50', '01:00', '01:10',
'01:20', '01:30',
...
'22:20', '22:30', '22:40', '22:50', '23:00', '23:10', '23:20', '23:30',
'23:40', '23:50'],
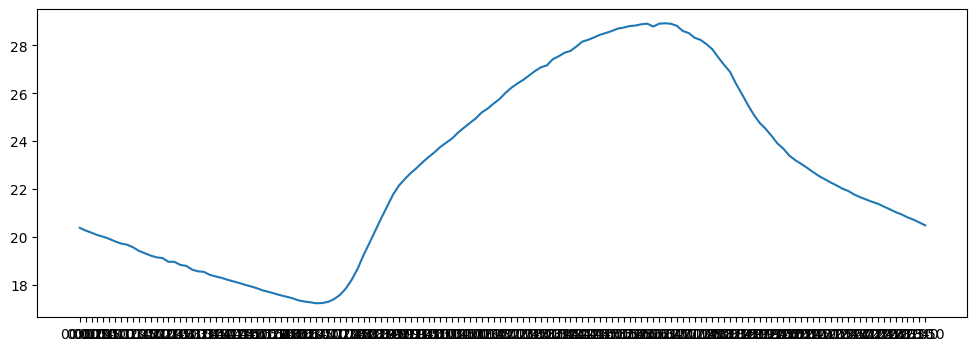
dtype='object', name='Fecha', length=51163)dia_promedio = tmx["To"].groupby(
by=[tmx.index.strftime("%H:%M")]
).mean()fig, ax = plt.subplots(figsize=(12,4))
ax.plot(dia_promedio)