import pandas as pd
import matplotlib.pyplot as plt27 Exploratory Data Analysis
f ="../data/002_processed/ikiam_Igs.csv"
pd.read_csv(f,index_col=0,parse_dates=True)| Ig_ghprm | Ig_ghrprm | |
|---|---|---|
| tiempo | ||
| NaT | 0.0 | 0.0 |
| 2024-05-11 00:01:00 | 0.0 | 0.0 |
| 2024-05-11 00:02:00 | 0.0 | 0.0 |
| 2024-05-11 00:03:00 | 0.0 | 0.0 |
| 2024-05-11 00:04:00 | 0.0 | 0.0 |
| ... | ... | ... |
| 2024-12-30 23:56:00 | 0.0 | 0.0 |
| 2024-12-30 23:57:00 | 0.0 | 0.0 |
| 2024-12-30 23:58:00 | 0.0 | 0.0 |
| 2024-12-30 23:59:00 | 0.0 | 0.0 |
| NaT | 0.0 | 0.0 |
336961 rows × 2 columns
f = "../data/002_processed/ikiam_Igs.parquet"
Igs = pd.read_parquet(f)

f = "../data/002_processed/ikiam_tgs.parquet"
tgs = pd.read_parquet(f)Igs.info()<class 'pandas.core.frame.DataFrame'>
DatetimeIndex: 336961 entries, NaT to NaT
Data columns (total 2 columns):
# Column Non-Null Count Dtype
--- ------ -------------- -----
0 Ig_ghprm 336961 non-null float64
1 Ig_ghrprm 276016 non-null float64
dtypes: float64(2)
memory usage: 7.7 MBIgs.describe()| Ig_ghprm | Ig_ghrprm | |
|---|---|---|
| count | 336961.000000 | 276016.000000 |
| mean | 0.007940 | 124.647292 |
| std | 0.015134 | 229.345926 |
| min | 0.000000 | 0.000000 |
| 25% | 0.000000 | 0.000000 |
| 50% | 0.000000 | 0.760000 |
| 75% | 0.010000 | 145.130000 |
| max | 0.080000 | 1337.520000 |
tgs.info()<class 'pandas.core.frame.DataFrame'>
DatetimeIndex: 336961 entries, NaT to NaT
Data columns (total 7 columns):
# Column Non-Null Count Dtype
--- ------ -------------- -----
0 tg1prm 0cm 276016 non-null float64
1 tg2prm 5cm 276016 non-null float64
2 tg3prm 10cm 276016 non-null float64
3 tg4prm 30cm 276016 non-null float64
4 tg5prm 50cm 276016 non-null float64
5 tg6prm 60cm 276016 non-null float64
6 tg7prm 80cm 276016 non-null float64
dtypes: float64(7)
memory usage: 20.6 MBtgs.describe()| tg1prm 0cm | tg2prm 5cm | tg3prm 10cm | tg4prm 30cm | tg5prm 50cm | tg6prm 60cm | tg7prm 80cm | |
|---|---|---|---|---|---|---|---|
| count | 276016.000000 | 276016.000000 | 276016.000000 | 276016.000000 | 276016.000000 | 276016.000000 | 276016.000000 |
| mean | 24.548940 | 24.533382 | 24.504500 | 24.517023 | 24.513674 | 24.535478 | 24.522438 |
| std | 4.649202 | 3.813553 | 1.985408 | 1.433576 | 1.097241 | 0.784723 | 0.463283 |
| min | 17.230000 | 18.500000 | 20.820000 | 21.300000 | 21.600000 | 22.520000 | 23.210000 |
| 25% | 21.600000 | 22.110000 | 23.190000 | 23.520000 | 23.630000 | 23.860000 | 24.150000 |
| 50% | 22.930000 | 23.310000 | 24.090000 | 24.320000 | 24.460000 | 24.400000 | 24.430000 |
| 75% | 25.900000 | 25.700000 | 25.370000 | 25.300000 | 25.110000 | 25.160000 | 25.070000 |
| max | 48.000000 | 45.360000 | 35.520000 | 30.650000 | 27.980000 | 26.700000 | 25.340000 |
Igs.plot(subplots=True, figsize=(12,8))array([<Axes: xlabel='tiempo'>, <Axes: xlabel='tiempo'>], dtype=object)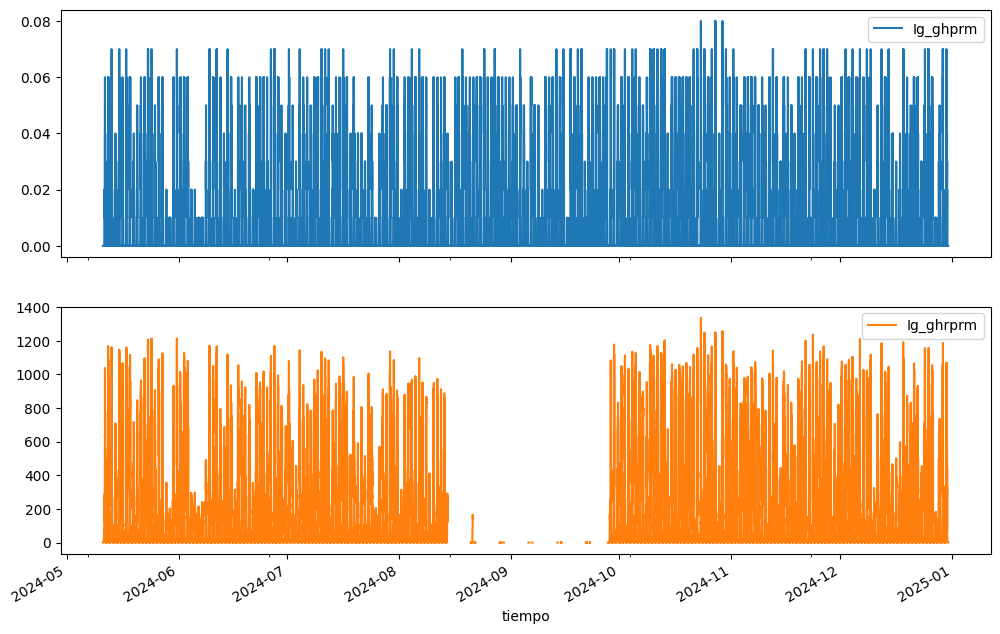
tgs.plot(subplots=True,figsize=(12,10));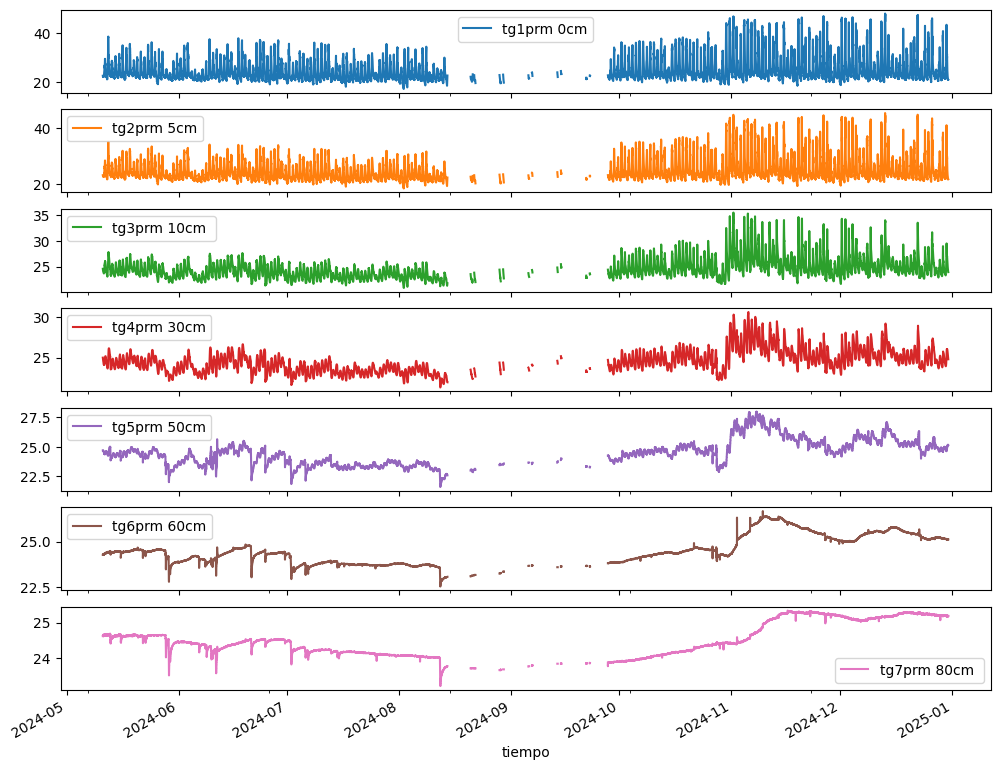
Contabilizar NaNs por mes y columna
Igs.isna().resample("ME").sum()| Ig_ghprm | Ig_ghrprm | |
|---|---|---|
| tiempo | ||
| 2024-05-31 | 0 | 0 |
| 2024-06-30 | 0 | 0 |
| 2024-07-31 | 0 | 0 |
| 2024-08-31 | 0 | 23214 |
| 2024-09-30 | 0 | 37690 |
| 2024-10-31 | 0 | 0 |
| 2024-11-30 | 0 | 0 |
| 2024-12-31 | 0 | 0 |
tgs.isna().resample("ME").sum()| tg1prm 0cm | tg2prm 5cm | tg3prm 10cm | tg4prm 30cm | tg5prm 50cm | tg6prm 60cm | tg7prm 80cm | |
|---|---|---|---|---|---|---|---|
| tiempo | |||||||
| 2024-05-31 | 0 | 0 | 0 | 0 | 0 | 0 | 0 |
| 2024-06-30 | 0 | 0 | 0 | 0 | 0 | 0 | 0 |
| 2024-07-31 | 0 | 0 | 0 | 0 | 0 | 0 | 0 |
| 2024-08-31 | 23214 | 23214 | 23214 | 23214 | 23214 | 23214 | 23214 |
| 2024-09-30 | 37690 | 37690 | 37690 | 37690 | 37690 | 37690 | 37690 |
| 2024-10-31 | 0 | 0 | 0 | 0 | 0 | 0 | 0 |
| 2024-11-30 | 0 | 0 | 0 | 0 | 0 | 0 | 0 |
| 2024-12-31 | 0 | 0 | 0 | 0 | 0 | 0 | 0 |