import pandas as pd
import matplotlib.pyplot as plt
from tools.importaciones import importa_excel
import glob as glob
import missingno as msno33 Une dos archivos en un dataframe, esolmet y ruoa
f = "../data/001_raw/2018-2019-VIENTO-TMIX-RUOA.txt"
ruoa = pd.read_csv(f,
                   usecols=["TIMESTAMP","WSpeed_Avg","WDir_Avg"],
                   # usecols=["WDir_Avg","WSpeed_Avg"],
                   # usecols=[0,4,5],
                   skiprows=[0,2,3],
                   encoding="ANSI",
                   delimiter="\t",
                   index_col=0,
                   parse_dates=True,
                   dayfirst=True,
                  )
ruoa = ruoa.resample("10Min").mean()
ruoa = ruoa[ruoa.index.year == 2018]
ruoa.index.duplicated()
array([False, False, False, ..., False, False, False], shape=(52560,))ruoa[ruoa.index.duplicated()]| WSpeed_Avg | WDir_Avg | |
|---|---|---|
| TIMESTAMP |
files = glob.glob("../data/001_raw/*.xls")

esolmet = pd.concat([importa_excel(file) for file in files])
esolmet = esolmet[esolmet.index.year == 2018]
del  esolmet["Viento Vel."]
esolmet = esolmet.resample("10Min").mean()esolmet.loc["2018-02-01"]| Directa | Global | Difusa | UV | Temperatura | Humedad | Presiòn Bar. | |
|---|---|---|---|---|---|---|---|
| Fecha | |||||||
| 2018-02-01 00:00:00 | 0.003 | 0.0 | 0.0 | 0.001 | 15.38 | 53.71 | 878.2341 |
| 2018-02-01 00:10:00 | 0.313 | 0.0 | 0.0 | 0.001 | 15.71 | 50.03 | 878.1605 |
| 2018-02-01 00:20:00 | 0.029 | 0.0 | 0.0 | 0.001 | 15.57 | 51.52 | 877.9796 |
| 2018-02-01 00:30:00 | 0.013 | 0.0 | 0.0 | 0.001 | 15.23 | 52.00 | 877.9725 |
| 2018-02-01 00:40:00 | 0.001 | 0.0 | 0.0 | 0.001 | 15.28 | 51.80 | 878.0463 |
| ... | ... | ... | ... | ... | ... | ... | ... |
| 2018-02-01 23:10:00 | 0.113 | 0.0 | 0.0 | 0.001 | 19.11 | 41.47 | 878.6667 |
| 2018-02-01 23:20:00 | 0.248 | 0.0 | 0.0 | 0.001 | 19.57 | 41.13 | 878.7175 |
| 2018-02-01 23:30:00 | 0.034 | 0.0 | 0.0 | 0.001 | 19.59 | 41.47 | 878.7158 |
| 2018-02-01 23:40:00 | 0.033 | 0.0 | 0.0 | 0.001 | 19.38 | 41.95 | 878.7092 |
| 2018-02-01 23:50:00 | 0.100 | 0.0 | 0.0 | 0.001 | 19.42 | 41.27 | 878.9540 |
144 rows × 7 columns
esolmet[esolmet.index.duplicated()].indexDatetimeIndex([], dtype='datetime64[ns]', name='Fecha', freq='10min')data = pd.concat([ruoa,esolmet],axis=1)
data| WSpeed_Avg | WDir_Avg | Directa | Global | Difusa | UV | Temperatura | Humedad | Presiòn Bar. | |
|---|---|---|---|---|---|---|---|---|---|
| 2018-01-01 00:00:00 | 1.1817 | 300.1500 | 0.057 | 0.0 | 0.0 | 0.001 | 18.93 | 41.57 | 879.0692 |
| 2018-01-01 00:10:00 | 1.2568 | 306.2400 | 0.002 | 0.0 | 0.0 | 0.001 | 18.76 | 41.00 | 879.4363 |
| 2018-01-01 00:20:00 | 1.6964 | 348.8100 | 0.170 | 0.0 | 0.0 | 0.001 | 18.92 | 40.96 | 879.5181 |
| 2018-01-01 00:30:00 | 2.2944 | 348.3400 | 0.371 | 0.0 | 0.0 | 0.001 | 18.52 | 42.46 | 879.5826 |
| 2018-01-01 00:40:00 | 1.6643 | 210.8732 | 0.305 | 0.0 | 0.0 | 0.001 | 18.49 | 42.43 | 879.6826 |
| ... | ... | ... | ... | ... | ... | ... | ... | ... | ... |
| 2018-12-31 23:10:00 | 1.5977 | 331.0400 | 0.125 | 0.0 | 0.0 | 0.000 | 18.88 | 59.60 | 875.5595 |
| 2018-12-31 23:20:00 | 2.3029 | 323.7000 | 0.000 | 0.0 | 0.0 | 0.000 | 18.71 | 59.67 | 875.5595 |
| 2018-12-31 23:30:00 | 2.0789 | 186.7430 | 0.044 | 0.0 | 0.0 | 0.000 | 18.52 | 58.75 | 875.2889 |
| 2018-12-31 23:40:00 | 0.8253 | 80.1400 | 0.170 | 0.0 | 0.0 | 0.000 | 18.36 | 60.62 | 875.0606 |
| 2018-12-31 23:50:00 | 1.0315 | 276.9384 | 0.003 | 0.0 | 0.0 | 0.000 | 17.99 | 60.76 | 875.1424 |
52560 rows × 9 columns
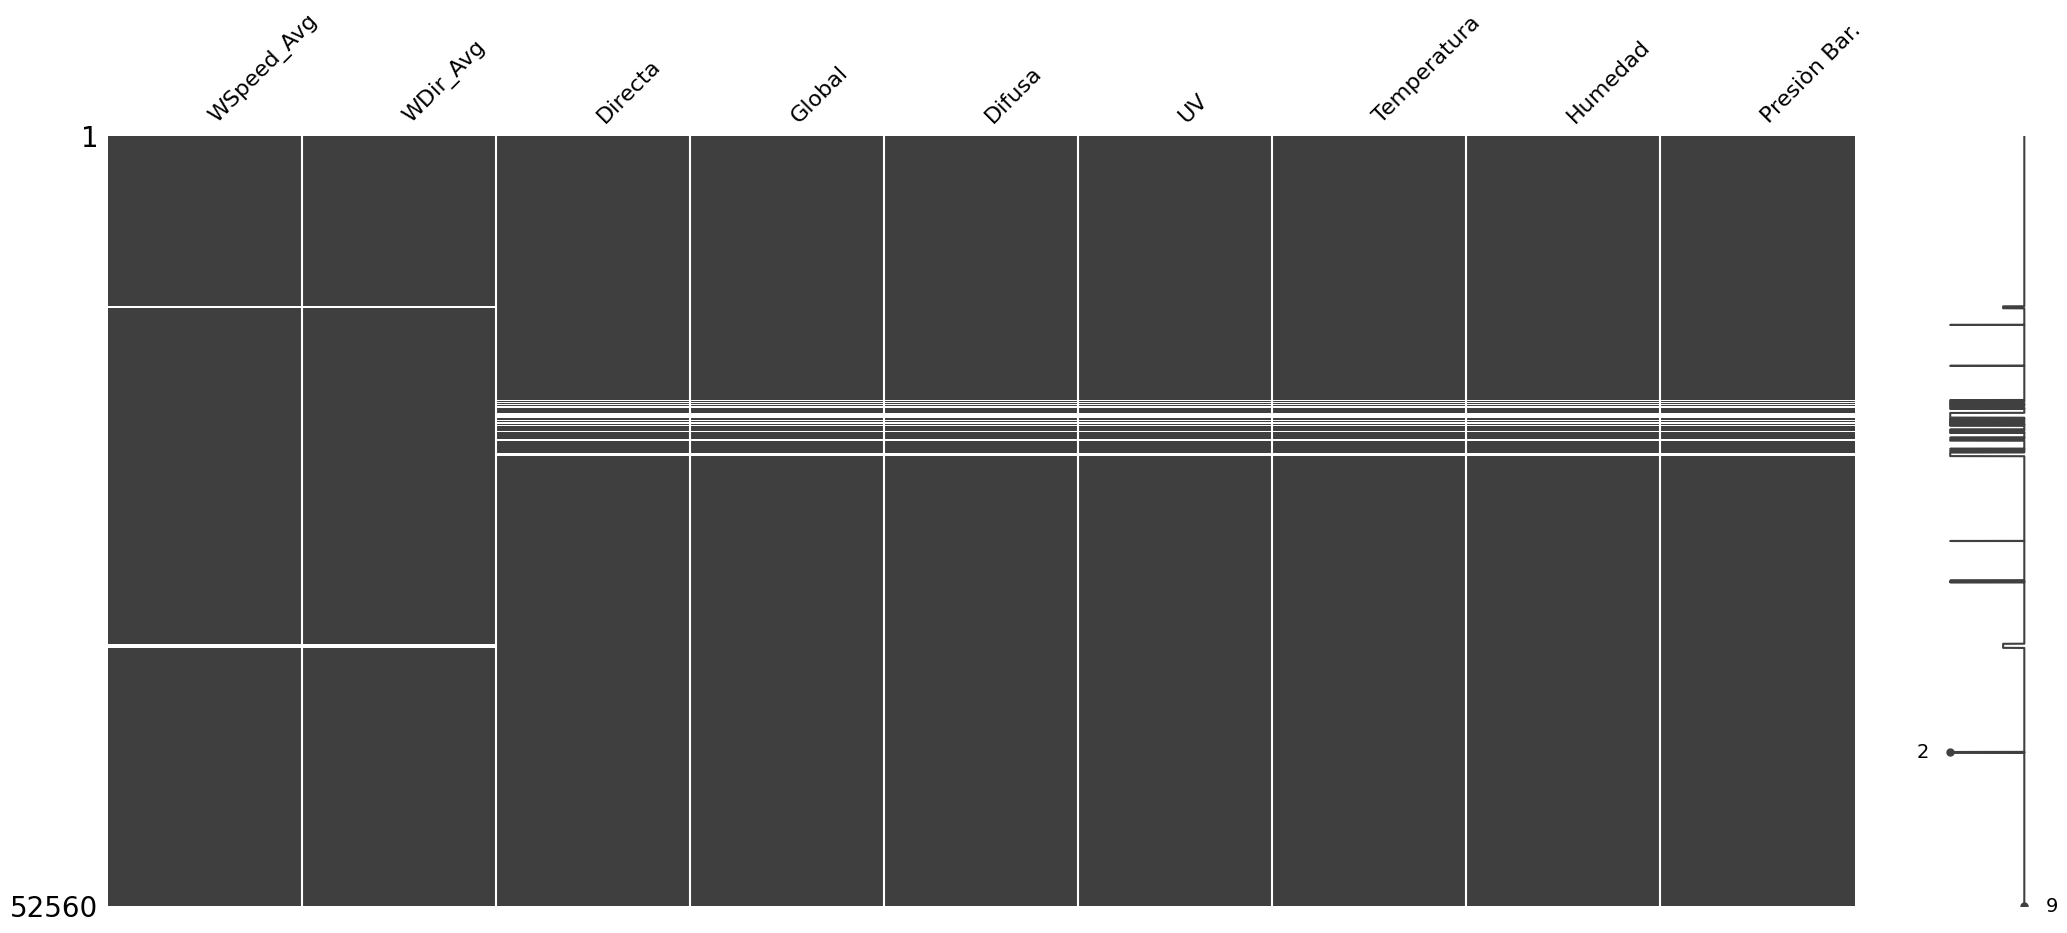
data.to_csv("../data/002_processed/esolmet_ruoaWSWD_2018.parquet")msno.matrix(data)